US search interest in notes apps up 194% in five years
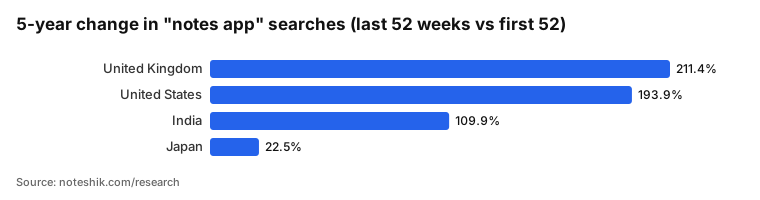
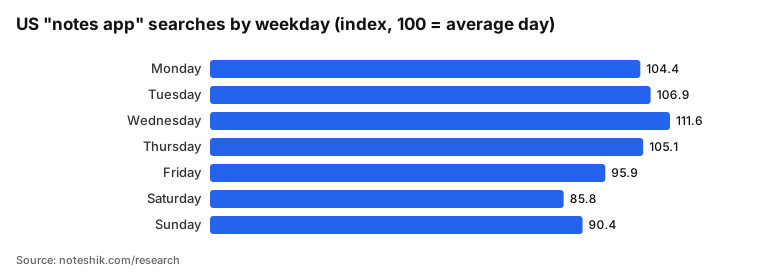
Google Trends data shows US search interest in "notes app" up 193.9% and UK interest up 211.4% over five years, with a midweek peak and a Saturday low.
Key findings
- Google searches for "notes app" in the last 52 weeks ran 193.9% above the first 52 weeks of the 5-year window in the United States, and 211.4% above in the United Kingdom.
- India grew 109.9% on the same measure. Japan, searching "メモアプリ", grew only 22.5%.
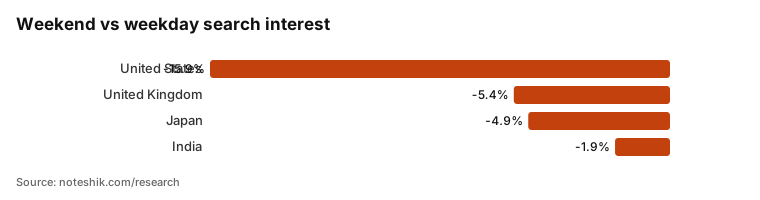
- In the US, searches fall 15.9% on weekends compared with weekdays. Wednesday is the busiest day (index 111.6) and Saturday the slowest (85.8).
- Saturday is the slowest day in the US, UK and Japan. In India the slowest day is Friday and the weekend gap is only 1.9%.
- Japan and India search most on Monday (index 115.0 and 108.5); the US and UK peak on Wednesday.
- In one week of hourly US data (Central time), the busiest hour was 2am (index 113) and the quietest 5am (79). The six hours from 9pm to 3am averaged 110, above the daytime average.
Full data
Download the CSV (28 rows). Free to reuse with a link to this page (CC BY 4.0).
| Country | Search term | Days of data | Mon index | Tue index | Wed index | Thu index | Fri index | Sat index | Sun index | Weekend vs weekday % | Busiest day | Slowest day | Avg interest first 52 weeks | Avg interest last 52 weeks | 5-year change % |
|---|---|---|---|---|---|---|---|---|---|---|---|---|---|---|---|
| United States | notes app | 92 | 104.4 | 106.9 | 111.6 | 105.1 | 95.9 | 85.8 | 90.4 | -15.9 | Wednesday | Saturday | 24.8 | 72.8 | 193.9 |
| United Kingdom | notes app | 92 | 107.9 | 97.8 | 108.8 | 98.4 | 94.9 | 92.7 | 99.5 | -5.4 | Wednesday | Saturday | 22.4 | 69.7 | 211.4 |
| India | notes app | 90 | 108.5 | 104.4 | 101 | 97.6 | 91.2 | 94.2 | 103 | -1.9 | Monday | Friday | 29.4 | 61.6 | 109.9 |
| Japan | メモアプリ | 88 | 115 | 105.7 | 99.8 | 93.9 | 92.8 | 92.3 | 100.6 | -4.9 | Monday | Saturday | 34 | 41.6 | 22.5 |
| United States (hour, Central time) | notes app @ 12am | 7 | 107.9 | ||||||||||||
| United States (hour, Central time) | notes app @ 1am | 7 | 110.4 | ||||||||||||
| United States (hour, Central time) | notes app @ 2am | 7 | 113.5 | ||||||||||||
| United States (hour, Central time) | notes app @ 3am | 7 | 86.2 | ||||||||||||
| United States (hour, Central time) | notes app @ 4am | 7 | 87 | ||||||||||||
| United States (hour, Central time) | notes app @ 5am | 7 | 78.7 | ||||||||||||
| United States (hour, Central time) | notes app @ 6am | 7 | 85.5 | ||||||||||||
| United States (hour, Central time) | notes app @ 7am | 7 | 94 | ||||||||||||
| United States (hour, Central time) | notes app @ 8am | 7 | 96.7 | ||||||||||||
| United States (hour, Central time) | notes app @ 9am | 7 | 104.8 | ||||||||||||
| United States (hour, Central time) | notes app @ 10am | 7 | 105.6 | ||||||||||||
| United States (hour, Central time) | notes app @ 11am | 7 | 102.5 | ||||||||||||
| United States (hour, Central time) | notes app @ 12pm | 7 | 99.4 | ||||||||||||
| United States (hour, Central time) | notes app @ 1pm | 7 | 102.7 | ||||||||||||
| United States (hour, Central time) | notes app @ 2pm | 7 | 100.6 | ||||||||||||
| United States (hour, Central time) | notes app @ 3pm | 7 | 99.8 | ||||||||||||
| United States (hour, Central time) | notes app @ 4pm | 7 | 99.2 | ||||||||||||
| United States (hour, Central time) | notes app @ 5pm | 7 | 96.7 | ||||||||||||
| United States (hour, Central time) | notes app @ 6pm | 7 | 98.2 | ||||||||||||
| United States (hour, Central time) | notes app @ 7pm | 7 | 100.6 | ||||||||||||
| United States (hour, Central time) | notes app @ 8pm | 7 | 101.7 | ||||||||||||
| United States (hour, Central time) | notes app @ 9pm | 7 | 107.3 | ||||||||||||
| United States (hour, Central time) | notes app @ 10pm | 7 | 110.4 | ||||||||||||
| United States (hour, Central time) | notes app @ 11pm | 7 | 110.6 |
Methodology
Source: Google Trends web-search interest, pulled on November 13, 2026 through the DataForSEO Google Trends Explore API. Google Trends reports relative interest from 0 to 100 within each request, not search counts, so values compare days and weeks within one country, not volumes between countries.
Search terms: "notes app" (United States, United Kingdom, India) and "メモアプリ" (Japan). We also requested local-language terms for Germany, France, Spain, Mexico, Brazil, Italy, South Korea and Indonesia. Google returned blank values for 33 to 78 of 92 days in those countries because volume was below its reporting floor, so they are excluded.
Weekday pattern: 90 days of daily data (August 13 to November 13, 2026). Each weekday's average is divided by the average of all seven weekday averages and multiplied by 100. Weekend vs weekday compares the Saturday and Sunday average with the Monday to Friday average.
Five-year change: weekly data for the past five years. We compare the average of the most recent 52 weeks with the average of the first 52 weeks in the window.
Hour of day: one week of hourly US data (November 6 to 13, 2026), converted to US Central time. Google applies one national clock, so late-night Central hours include evening searches on the West Coast. Hourly data for the other countries had too many blank hours to use. Treat the hourly figures as a single-week snapshot.
Sources
Use this chart
Journalists, bloggers and teachers may republish the charts and data with credit. Copy this embed code:
Press questions: [email protected]